How a Taiwanese Oolong changed the way I look at tea
From drinking tea, to scraping a tea dataset, to hyperdimensional computing experiments.
Having grown up in India, I’m no stranger to loose-leaf tea 🫖 - though in India, you most often drink black tea or chai, without really questioning where the tea came from. Things changed when I got some Ali Shan Oolong tea from Taiwan as a gift. I was struck by how the roasted Ali Shan had a totally distinct flavour profile from the unroasted kind. It made me want to understand how tea processing impacts its flavour.
My prior knowledge of tea involved only the very broad categories: green, black, oolong, etc. Little did I know about the ocean of botanical complexity underneath each type, and how many subtypes there were. It was a nice rabbit hole to fall into, and I spent a few months learning about the different types of tea, their processing techniques, and what makes a good cup of tea.
Recently, I’ve also been discussing some ideas around hyperdimensional computing (HDC) with my friend and colleague David Hughes ⤴. David’s been doing some amazing work in this space for while now, and we each presented our perspectives on HDC at the recently concluded GraphCon1 in Seattle.
So how does tea have any connection to a topic like HDC? It turns out that we can describe any tea using rich and varied metadata: tasting notes and aromas in words, elevation of its growing location as numbers, and oxidation and roasting in levels. This makes it possible to encode each tea and its features as very high-dimensional vectors (10,000 dimensions or more) so that we can find similar teas in this high-dimensional space using HDC algebra. This is going to be explored in detail in the next post.
Going down this road, the insights I’ve gained are truly fascinating, so strap in and join me in this journey! 🚀
The different types of tea#
To learn more about tea, I first went through this amazing YouTube “masterclass on tea” ⤴ by Dylan O’Neill Rothenberg of Wu Mountain Tea ⤴. Dylan holds a PhD in tea science and does a truly marvellous job of breaking down tea chemistry and what to look for in good teas.
Learning from Dylan through this series gave me an intuitive understanding of why I liked certain teas more than others.
What’s called “tea” comes from a plant called Camellia sinensis, whose origins are from the western Yunnan region of China, from where it spread to the rest of China, India, and eventually the world. The plant is a perennial shrub or tree that can live for decades (sometimes centuries), and it produces new shoots every spring. The leaves of these shoots are plucked and processed into tea.
Today, tea is processed into six major types, listed in the table below. There are many other kinds of plants that are colloquially also called “tea” (like chamomile, rooibos, hibiscus and other herbal blends), but they aren’t from the same Camellia sinensis plant, and aren’t the focus of this post.
| Category | Chinese | Oxidation level | What’s done to the leaf | Typical character |
|---|---|---|---|---|
| Green | 绿茶 (lü cha) | Least oxidized | Heat applied early to halt oxidation | Grassy, vegetal, nutty, sweet |
| White | 白茶 (bai cha) | Minimally oxidized | Withered and dried, and almost nothing else | Delicate, hay-like, honeyed |
| Yellow | 黄茶 (huang cha) | Lightly oxidized | Green tea, plus a slow damp “sealed yellowing” step | Green tea with the sharp edge sanded off |
| Oolong | 乌龙茶 (wu long cha) | Partially oxidized | Leaf edges bruised repeatedly, partially oxidized, often roasted | Floral, creamy, buttery, fruity |
| Black (Red) | 红茶 (hong cha) | Fully oxidized | Rolled and fully oxidized | Malty, fruity, brisk |
| Dark | 黑茶 (hei cha) | Oxidized and post-fermented | Post-fermented by microbes over months or years | Earthy, woody, mellow |
The level of oxidation in the tea leaf ranges from almost none (green tea) to fully oxidized (black tea). Oolong tea is partially oxidized, and dark tea is both oxidized and post-fermented by microbes over months or years. Interestingly, “black tea” literally translates to red tea in Chinese (hong cha) because the liquor produced by the leaf tends to be reddish-brown. The term “black tea” was coined by early western traders, probably due to the colour of the oxidized leaf.
Of everything I’ve tried so far, multiple oolong and black teas have been my favourites, but I fully expect my palate to shift as I work through more of the world’s amazing teas.
What’s actually in a cup of tea#
Here’s the part I find delightful: none of what the tea plant produces is for the benefit of humans. Its polyphenols act as chemical defence against pests and UV radiation, caffeine is a natural insecticide, and amino acids are a vehicle to store nitrogen for new growth.
There are five families of compounds in tea that each have their own effect on the flavour and mouthfeel of the liquor. The table below summarizes them.
| Compound family | Roughly, % of dry leaf | What it does on the palate |
|---|---|---|
| Polyphenols (catechins) | 20-30% | Astringency and bitterness; EGCG is the most abundant |
| Amino acids (L-theanine, glutamate) | 1-5% | Umami, savoury sweetness, mellowness |
| Caffeine | 2-4% | Bitterness, plus the obvious alertness effects |
| Volatile aromatics (linalool, tarpenes) | under 0.05% | Essentially all of the aroma |
| Sugars, polysaccharides (pectins) | 1-4% soluble | Sweetness, honey/caramel notes, and viscosity - the “thickness” in the mouth |
Why does knowing the composition matter? The aroma, flavour and mouthfeel of a tea are all determined by the relative balance of these compounds, which is why teas from different regions, cultivars, climates, elevation and processing methods taste so different.
L-theanine deserves its own mention, because it’s an amino acid found almost nowhere outside tea. It’s the source of that savoury, brothy, umami quality, and it’s also why tea’s caffeine feels so unlike coffee’s. Theanine crosses the blood-brain barrier and takes the edge off caffeine’s jitter, making tea a more mellow and sustained source of alertness than coffee.
Oxidation transforms the polyphenols. Once the leaf is picked from the bush, the enzymes get going, and the catechins get stitched into bigger molecules that grow larger and darker at every stage: theaflavins first (bright orange and brisk, and often more abundant in an oolong than in a fully oxidized black tea), then thearubigins (red-brown, and the source of a black tea’s body and colour), and finally theabrownins, the near-black pigments microbes produce to create dark (e.g., Pu’er) tea.
Aroma is where things get genuinely wild. Hundreds of volatile compounds have been identified in tea, and many of them recur in different proportions to produce a unique aroma for every tea: linalool (floral, citrusy), geraniol (rose), cis-3-hexenal (fresh-cut grass), and the pyrazines and furans that roasting creates through Maillard reactions2. Each batch of tea leaves can survive multiple brews, though most of the volatile compounds are released during the first brew (the second and third infusions are more about taste and mouthfeel than aroma).
How elevation affects flavour profile#
You’ll notice the world’s great teas only come from a handful of places. Tea grows naturally on mountainsides, where it gets the cool, humid climate, the acidic and well-drained soil, and enough slope that water never pools around the roots. It’s a very specific set of conditions, explaining why it’s so geographically concentrated.
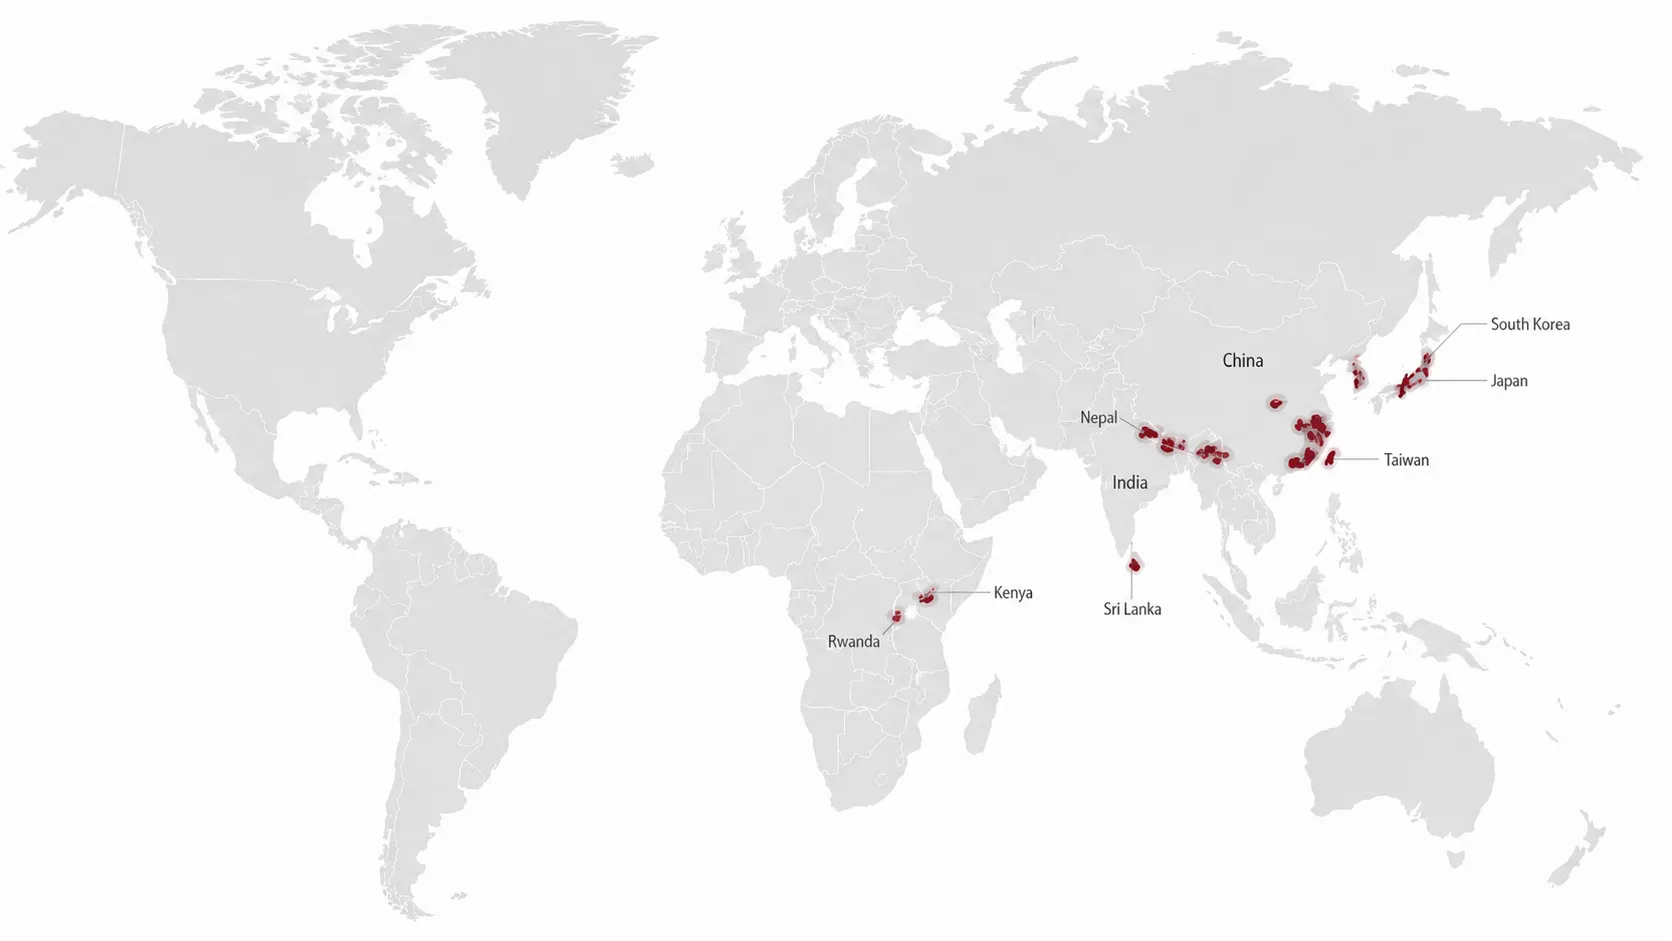
Elevation above sea level matters greatly for the overall taste and texture of the tea. Higher altitudes are cooler, and cold slows the plant down: the shoots take longer to mature, so the leaf accumulates amino acids rather than immediately spending them on new growth. Meanwhile, catechin production, which is driven by warmth and strong light, falls off, but pectins and sugars become more prominent.
Fewer catechins means less bitterness and astringency. More amino acids means more umami and sweetness. It’s why the same cultivar grown at higher elevations tends to be lighter in taste, yet thicker on the tongue. For example, the Ali Shan tea I was so enamoured with grows at around 1,400m. Many others grow at altitudes well below 1000m, such as the Darjeeling blacks from India and Longjing greens from China.
Let’s summarize how both processing and elevation affect tea:
- The colour of tea comes from processing: the level of oxidation, and how the leaves are heated and handled after plucking.
- The flavour and mouthfeel of tea is affected by elevation and cultivar: the “cultivated variant”, also known as cultivar, decides the genetic makeup of the tea plant, influencing its growth characteristics and chemical composition. Additionally, different elevations produce different balances of polyphenols and amino acids, which directly affect how they are perceived on the palate.
From chemistry to a tea dataset#
All this studying gave me this key insight: with a sufficiently rich vocabulary around tasting notes, aroma and metadata like elevation, I could encode teas as hypervectors in a very high-dimensional space (we’ll explore that more in the upcoming HDC series3). Each tea would be a point in high-dimensional vector space, and the distance between points would correspond to how similar they are.
The high-dimensional vectors that hyperdimensional computing (HDC) creates are unlike traditional text/image embeddings that you may be used to from RAG. HDC vectors (known as “hypervectors”) are extremely high-dimensional (typically 10,000 dimensions or more), and they’re generated with custom encoders. Importantly, the encoder can compose multiple types of data (text, numbers, categorical variables, etc.), allowing us to perform elegant vector arithmetic.
A tea dataset would be a perfect experiment to design an encoder that combines multiple kinds of information: aroma and taste (text), elevation (integers), and roast/oxidation (categorical variables). To design the encoder, we’d need detailed descriptions of what aromas and flavours emerge as it’s brewed, and the elevation of the tea-growing region.
This is where I ran into a problem: there wasn’t much public data like this available. So I went ahead and built my own, by scraping 100+ loose-leaf teas and their descriptions from Cha Yi ⤴, a premium online tea vendor in Gatineau, Quebec, Canada. Their product descriptions are unusually specific about origin and tasting notes. Here’s one example of a tea record for the Ali Shan I mentioned earlier:
{
  "id": 9378918800,
  "description": "This tea evokes us of: 🌿LEMONGRASS - 🍑WHITE PEACH - 🌸LAVENDER - 👃🏻COMPLEX Grown without artificial pesticides, herbicides, or chemical fertilizers by Mr. Lai near the village of Shi Tou, this tea offers again this year a brew of surprising aromatic complexity. With its rich flavors, intoxicating floral aromas reminiscent of lavender and hyacinth, orchard fruits, citrus peel, or lemongrass notes as well as a full and buttery texture, this tea is a real treat! ...",
  "aroma": [
    "LEMONGRASS",
    "WHITE PEACH",
    "LAVENDER",
    "intoxicating floral aromas reminiscent of lavender and hyacinth",
    "orchard fruits",
    "citrus peel",
    "lemongrass notes"
  ],
  "taste": ["full and buttery texture"],
  "country": "Taiwan",
  "region": "Shi Tou"
}
The two sensory fields aroma and taste are derived features from the raw text description. The aroma field captures the volatiles: lavender and hyacinth are almost certainly from linalool, and the citrus peel and lemongrass notes come from a family of terpenes. The taste field is intended to capture everything that’s felt on the tongue. Ali Shan is incredibly thick and buttery, which is a result of the larger amounts of pectins and amino acids from the elevation it’s grown in.
Elevation of the tea-growing region is an important field I wanted, but no vendor published it, so I spent some time designing an LLM-based pipeline that can use a web search tool to populate this value based on the country and region fields. For example, “Shi Tou” is a village in the Ali Shan mountain range of central Taiwan, and that’s enough to place this tea at around 1,400 m with reasonable confidence, rounded to the nearest multiple of 50.
The elevation extraction pipeline produces something like this, which is suitable for human inspection:
{
  "region": "Shi Tou",
  "country": "Taiwan",
  "elevation_tool_call": {
    "name": "search_elevation",
    "args": { "region": "Shi Tou", "country": "Taiwan" }
  },
  "elevation_search_query": "Shi Tou, Taiwan typical average elevation altitude above sea level metres",
  "elevation_basis": "tavily",
  "elevation_raw_meters": 1400,
  "elevation_meters": 1400,
  "elevation_confidence": 1.0
}
The full end-to-end data pipeline is shown in the data/ directory of the source repo ⤴ for this project. It uses DSPy to orchestrate the LLM calls, and a Tavily web search tool to extract elevation levels for the region and country fields.
I ended up with a dataset of 166 teas suitable for encoding into hypervectors. The dataset consists of a mix of green, white, yellow, oolong and black tea (five kinds, excluding dark/Pu’erh tea). The data is available on Hugging Face Hub in Lance format:

Lance ⤴ is an open-source, columnar lakehouse format built for multimodal AI data. A Lance dataset consists of tables, where each feature (elevation, region, country etc.) is a column in a particular table. The main benefit of using Lance is that you get fast search, versioning, and vector/full-text search indexes and multimodal blobs living alongside the metadata rather than in a separate system. For this tea dataset, that means one table holds the tea text, the scalar metadata, the images of tea leaves as raw bytes, and a full-text search index over description.
It’s also very simple to use LanceDB to scan and query the dataset straight off Hugging Face Hub, with no separate download step:
import lancedb

db = lancedb.connect("hf://datasets/prrao87/tea-hypervectors/data")
table = db.open_table("train")

oolongs = (
    table.search()
    .where("class = 'oolong'")
    .select(["title", "region", "elevation_meters", "aroma", "taste"])
    .limit(3)
    .to_list()
)
print(oolongs)
Which gives us:
title | region | elevation_meters | aroma | taste |
|---|---|---|---|---|
| Ali Shan | Shi Tou | 1400 | LEMONGRASS, WHITE PEACH, LAVENDER, intoxicating floral aromas reminiscent of lavender and hyacinth, orchard fruits, citrus peel, lemongrass notes | full and buttery texture |
| Ali Shan - Roasted | Ali Shan | 1400 | honey, caramel, butter, opulent flowers, exotic fruits | (none stated) |
| Bai Hao | Beipu | 450 | muscatel grapes, flowers, honey, baked apples and pears, sweet spices, summer honey, white flowers | almost syrupy texture, fruity finish is rich and heady |
The full dataset is quite rich, so I highly recommend exploring it and finding out if your favourite tea is in there!
From a research project… to a way of life#
Somewhere along the way this fascination with tea blended into my daily life. I’ve been wandering into tea shops I’d walked past for years, exploring and buying teas I’d never heard of before. I became familiar not only with tea’s chemistry, but also with its geography, learning which specific regions in the world are known for certain kinds of tea.
Most surprisingly, tea has quietly replaced almost all of the coffee I used to drink, and I’ve noticed three major positive effects since I began drinking tea on a regular basis:
Steady alertness, all day. The fact that tea contains both caffeine and L-theanine explains this. There’s less caffeine per cup of tea than in coffee, and the leaves are of such high quality that I can brew the same batch 2-3 times over an hour or two, so the caffeine dose arrives gradually instead of all at once. The 2pm post-lunch slump that used to be a fixture of my afternoons is just gone.
Better hydration. Multiple infusions per batch of leaves means I drink far more water in a day than I ever did on 1-2 coffees. The lower caffeine dose, spread over a longer window, probably helps reduce its diuretic effects too. With coffee, I needed to remember to drink water, but with tea, I just do it automatically.
No hunger pangs. I feel no urge to snack in between meals. Tea has a long reputation for blunting appetite, and whatever the mechanism, I now only eat at meal times, and my body thanks me for it.
None of this was my initial goal. All I did was set out to understand why one box of tea tasted so different from another, and now, drinking tea is a holistic part of my life. I feel more alert, more hydrated, and more in tune with my body than I have in years, and this has had spillover effects on my ability to exercise, sleep and breathe more calmly.
Where this goes next#
This post began with how I developed a fascination with tea, which led to me building a tea dataset that I can actually analyze and explore further. Preparing the dataset turned out to be quite the data engineering task: after scraping public data, it also involved pulling sensory fields out of the product marketing prose with an LLM, and manually verifying elevations for villages and regions nobody has published numbers for.
Next, it’s time for the fun part. Every one of the 166 teas in the dataset gets encoded as a hypervector: a 10,000-dimensional vector that holds aroma, taste, class, oxidation, roast and elevation all at once, in a composable way that lets you extract each one back out afterwards. I’ll explore this dataset more deeply in three parts:
-
Fundamentals. What hyperdimensional computing actually is, and the three operators (binding, bundling and permutation) that make it work. We’ll build up an intuition for why a 10,000-dimensional space behaves so differently from the embedding spaces you’re used to, and how to work with hypervectors using TorchHD and LanceDB.
-
Building an encoder. How to encode the data to produce hypervectors of each record, so that we can run associative search. We’ll also look at how graphs and high-dimensional hypervectors can naturally express the same data in discrete vs. continuous space.
-
Machine learning. A tea recommender built from nothing but the teas you’ve liked and disliked. No gradient descent, no retraining, and no thousands of labelled examples - HDC’s operators give you an online learner that updates from a handful of samples and keeps learning as you feed it more.
We’ll look at all that, and more, in the upcoming series on HDC. In the meantime, go buy some loose-leaf tea, keep sipping away 🍵, and see you in the next post!
Footnotes#
-
Slides ⤴ and video ⤴ from my GraphCon 2026 talk, on how graphs and high-dimensional vector spaces come together in HDC. ↩
-
Maillard reactions are a heat-driven browning reaction between amino acids and sugars, the same one that gives seared steak, toasted bread and roasted coffee their flavour. Here, it’s the tea leaf’s own heat-processing step doing the work instead of a pan or oven. ↩
-
The first post in the series is here. It covers the fundamentals of hyperdimensional computing, and the three operators (binding, bundling and permutation) that make it work. We’ll build up an intuition for why a 10,000-dimensional space behaves so differently from the embedding spaces you’re used to, and discuss how to build a tea recommender system in future posts. ↩